

Info via CMS.gov:
Home Health Care Policies - Today, the Centers for Medicare & Medicaid Services (CMS) released a new dataset, the Hospice Utilization and Payment Public Use File (Hospice PUF). This data set, which is part of CMS’s suite of Medicare Provider Utilization and Payment Data files, details information on services provided to Medicare beneficiaries by hospice providers. These new data include information on 4,025 hospice providers, over 1.3 million hospice beneficiaries, and over $15 billion in Medicare payments for 2014. The data is posted on the CMS website at: https://www.cms.gov/Research-Statistics-Data-and-Systems/Statistics-Trends-and-Reports/Medicare-Provider-Charge-Data/Hospice.html.
For each hospice provider, the data set has the total number of days of care that were provided, distinct number of beneficiaries served, total charges, total Medicare payments, and total Medicare standardized payments. The hospice provider dataset has additional information on the number of hospice beneficiaries with hospice care days of less than seven, more than 60, and more than 180 in 2014. The Hospice PUF also includes data on primary diagnoses, sites of service, and hospice beneficiary demographics. The data set does not contain any individually identifiable information about Medicare beneficiaries. To further protect the privacy of Medicare beneficiaries, any aggregated records which are derived from ten or fewer claims are excluded from the Hospice PUF.
CMS created the Hospice PUF using information from Part A administrative claims submitted by hospice providers. The data set identifies individual hospice providers using their CMS Certification Number. It also includes the hospice provider name and address information.
The Hospice PUF data allow for many types of analyses to be performed, including comparisons between providers, states, and national benchmarks. Table 1 below displays the national spending and utilization rates. In 2014, Medicare spent an average of $11,393 per hospice beneficiary for an average of 70 days of hospice care. Of the 1.3 million hospice beneficiaries in 2014, 11 percent had a live discharge from hospice care, 33 percent had more than 60 days of hospice care, and 13 percent had more than 180 days of hospice care.
Table 1. National Hospice Spending and Utilization, 2014
| Measure | Total | Rate[1] |
| Hospice Beneficiaries | 1.3 million | |
| Medicare Payments | $15.1 billion | $11,393 per hospice beneficiary |
| Hospice Care Days | 92.3 million days | 70 days per hospice beneficiary |
| Total Live Discharges | 142,000 | 11% of hospice beneficiaires |
| Hospice beneficiaries with 7 or fewer hospice care days | 354,000 | 27% of hospice beneficiaires |
| Hospice beneficiaries with more than 60 hospice care days | 433,00 | 33% of hospice beneficiaires |
| Hospice beneficiaries with more than 180 hospice care days | 169,000 | 13% of hospice beneficiaires |
| Hospice beneficiaries with a primary diagnosis of cancer | 384,000 | 29% of hospice beneficiaires |
The hospice data can also be used for geographic comparisons of hospice care. Map 1 shows the variation in total standardized payments per hospice beneficiary by state. In 2014, states in the South had the highest total standardized spending per hospice beneficiary. South Carolina had the highest spending ($14,778), followed by Alabama ($14,361) and Mississippi ($14,100). The states with the lowest spending per hospice beneficiary were Wyoming ($7,132), South Dakota ($7,252), and Alaska ($7,442).
Map 1. Standardized Medicare Payment per Beneficiary in 2014, by State

Map 2 shows the percentage of hospice beneficiaries with a live discharge from hospice care in 2014 by state. A live discharge from hospice care occurs when a beneficiary elects hospice care, receives hospice services, and is discharged before death. A hospice beneficiary may have a live discharge due to a change in terminal prognosis, to resume curative treatment, or to change hospice providers. States in the South and Southwest had the highest rates of live discharge from hospice; Mississippi had the highest rate (20.6 percent) followed by South Carolina (18.3 percent). Kentucky had the lowest rate of live discharges from hospice (7.1 percent) with rates in Illinois, Ohio, and North Dakota also below eight percent.
Map 2. Percent of Hospice Beneficiaries with a Live Discharge from Hospice Care in 2014, by State

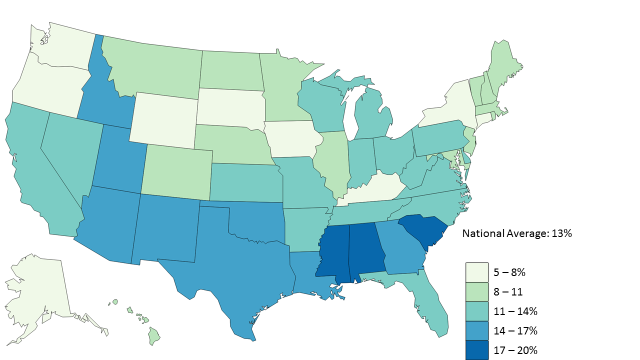
The Medicare hospice benefit is designed for beneficiaries with a terminal prognosis of six months (180 days) or less. Map 3 shows the percentage of hospice beneficiaries with more than 180 days of hospice care in 2014 by state. Although it may be difficult to accurately estimate how long a beneficiary will survive with a terminal condition, use of the hospice benefit for more than six months is notable. States in the South tended to have a higher percentage of hospice beneficiaries with more than 180 days of hospice care during the calendar year. The states with the highest rates were Alabama (18.4 percent), South Carolina (18.1 percent), and Mississippi (17.2 percent). The states with the lowest rates were Wyoming (5.4 percent), South Dakota (5.8 percent), and Alaska (6.6 percent).
Map 3. Percent of Hospice Beneficiaries with more than 180 Days of Hospice Care in 2014, by State
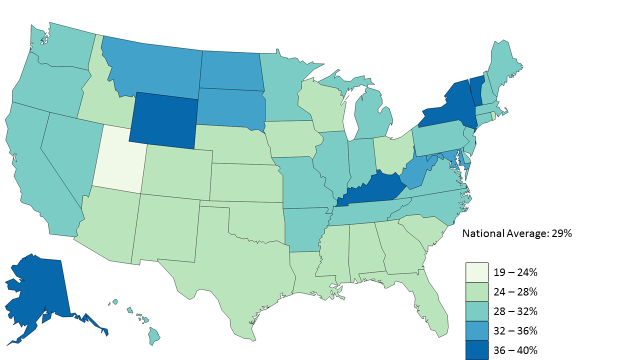
At the implementation of the Medicare hospice benefit in 1983, a significant portion of hospice beneficiaries presented with a cancer diagnosis; however, the hospice benefit is now more commonly used for non-cancer diagnoses. Map 4 shows the percentage of hospice beneficiaries with a primary diagnosis of cancer by state. States in the South tended to have a lower percentage of hospice beneficiaries with cancer diagnoses, although the state with the lowest rate was Utah (19.1 percent). Wyoming had the highest percentage of hospice beneficiaries with a primary diagnosis of cancer (40.0 percent), followed by New York (39.8 percent).
Map 4. Percent of Hospice Beneficiaries with a Primary Diagnosis of Cancer in 2014, by State
[1] These rates are based on a count of unduplicated beneficiaries.


