

via CMS.gov
Home Health Care Policies- Medicare Skilled Nursing Facility (SNF) Transparency Data (CY2013)
The Centers for Medicare & Medicaid Services (CMS) released a new dataset, the Skilled Nursing Facility Utilization and Payment Public Use File (SNF PUF). This data set, which is part of CMS’s Medicare Provider Utilization and Payment Data sets, details information on services provided to Medicare beneficiaries by skilled nursing facilities. The new data include information on 15,055 skilled nursing facilities, over 2.5 million stays, and almost $27 billion in Medicare payments for 2013. The data is posted on the CMS website at: https://www.cms.gov/Research-Statistics-Data-and-Systems/Statistics-Trends-and-Reports/Medicare-Provider-Charge-Data/SNF.html.
The data set identifies individual SNFs using their six-digit identification number. Services furnished by these SNFs are grouped according to resource utilization groups (RUGs). For each SNF and RUG, the data set has the total number of stays and days provided, number of beneficiaries served, the SNF’s total and average charges, the total and average allowed amounts, the total and average Medicare payments, and the total and average Medicare standardized payments.* The data set does not contain any individually identifiable information about Medicare beneficiaries. To further protect the privacy of Medicare beneficiaries, any aggregated records which are derived from ten or fewer beneficiaries are excluded from the SNF PUF.
The SNF PUF data allow for many types of analyses to be performed, including summary analyses by RUG. Table 1 displays the patterns of utilization and total Medicare payment amounts for the top ten RUGs by total payment. The RUG with the highest total Medicare payment at $7.77 billion was RUB (Ultra-High Rehab – ADL 6-10)+.
Table 1. Top Ten RUGs by Total Payment, 2013
| RUG | RUG Description | Total Days | Unique Beneficiaries Served | Total Medicare Payment Amount |
| RUB | Ultra-High Rehab - ADL 6-10 | 15,801,830 | 634,995 | $7,772,000,519 |
| RUC | Ultra-High Rehab - ADL 11-16 | 11,731,618 | 426,023 | $5,663,111,152 |
| RUA | Ultra-High Rehab - ADL 0-5 | 8,129,548 | 406,508 | $3,191,952,281 |
| RVC | Very-High Rehab - ADL 11-16 | 5,605,485 | 290,557 | $2,177,788,572 |
| RVB | Very-High Rehab - ADL 6-10 | 6,062,535 | 348,863 | $2,035,526,803 |
| RVA | Very-High Rehab - ADL 0-5 | 4,513,546 | 276,946 | $1,490,980,086 |
| RHC | High Rehab - ADL 11-16 | 2,293,066 | 140,256 | $731,069,932 |
| RHB | High Rehab - ADL 6-10 | 1,940,641 | 134,687 | $549,945,652 |
| RHA | High Rehab - ADL 0-5 | 1,647,680 | 117,422 | $397,568,297 |
| RMC | Medium Rehab - ADL 11-16 | 1,407,948 | 106,469 | $378,069,865 |
Table 2 displays the patterns of utilization and average Medicare payment amounts for the top ten RUGs by highest number of days. The RUG billed most frequently in 2013 was RUB (Ultra-High Rehab – ADL 6-10) with 15.8 million total days, an average Medicare payment amount per day of $492, and an average Medicare payment amount per beneficiary of $12,239.
Table 2. Top Ten RUGs by Number of Days, 2013
| RUG | RUG Description | Total Number of Days | Unique Beneficiaries Served | Average Medicare Payment Amount Per Day | Average Medicare Payment Amount Per Beneficiary |
| RUB | Ultra-High Rehab - ADL 6-10 | 15,801,830 | 634,995 | $492 | $12,239 |
| RUC | Ultra-High Rehab - ADL 11-16 | 11,731,618 | 426,023 | $483 | $13,293 |
| RUA | Ultra-High Rehab - ADL 0-5 | 8,129,548 | 406,508 | $393 | $7,852 |
| RVB | Very-High Rehab - ADL 6-10 | 6,062,535 | 348,863 | $336 | $5,835 |
| RVC | Very-High Rehab - ADL 11-16 | 5,605,485 | 290,557 | $389 | $7,495 |
| RVA | Very-High Rehab - ADL 0-5 | 4,513,546 | 276,946 | $330 | $5,384 |
| RHC | High Rehab - ADL 11-16 | 2,293,066 | 140,256 | $319 | $5,212 |
| RHB | High Rehab - ADL 6-10 | 1,940,641 | 134,687 | $283 | $4,083 |
| RHA | High Rehab - ADL 0-5 | 1,647,680 | 117,422 | $241 | $3,386 |
| RMC | Medium Rehab - ADL 11-16 | 1,407,948 | 106,469 | $269 | $3,551 |
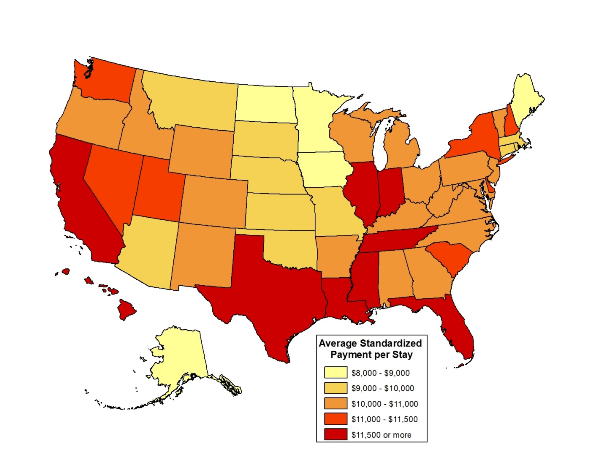
The SNF data can be also used for geographic comparisons of costs and utilization of SNF services. Map 1 below displays the average Medicare standardized payments per stay by state for 2013. Nationally, the average standardized payment amount per stay for all SNFs was $10,919, with an average length of stay of 28 days. As the map demonstrates, the states with the highest average standardized payment amounts per stay were Indiana ($12,406), Texas ($12,064), and California ($11,862), as well as several states in the Southeast. The states with the lowest per stay payment amounts were in the upper Midwest (e.g., $8,154 in North Dakota), Maine ($8,959), and Alaska ($8,854).
Map 1. Skilled Nursing Facility Average Standardized Payment per Stay, by State, 2013
Therapy Minutes
The SNF PUF also includes information on two categories of RUGs for patients who receive a significant amount of therapy. In order to qualify for an Ultra-High (RU) Rehabilitation RUG, a resident must receive at least 720 minutes of therapy each week, among other criteria. Similarly, in the case of the Very High (RV) Rehabilitation categories, the resident must receive at least 500 minutes of therapy each week. The SNF PUF includes the number of provider assessments where residents are classified into an Ultra-High Rehabilitation RUG or a Very-High Rehabilitation RUG. It also includes the percentage of those assessments that are within ten minutes of the minimum threshold used to classify a resident into that Rehabilitation RUG category (i.e., between 500-510 minutes for RV RUGs and 720-730 minutes for RU RUGs).
Based on this information, we found:
- 51 percent of all RV assessments showed therapy provided between 500 and 510 minutes.
- 65 percent of all RU assessments showed therapy provided between 720 and 730 minutes.
- For 88 providers, all of their RV assessments showed therapy provided between 500 and 510 minutes.
- For 215 providers, all of their RU assessments showed therapy provided between 720 and 730 minutes.
- More than one in five providers had more than 75 percent of both RU and RV assessments that showed therapy provided within 10 minutes of the minimum threshold.
To help ensure that patient need rather than payment incentives are driving provision of therapy services, CMS is providing approval to the Medicare Fee-for-Service Recovery Auditor Contractors (RACs) to investigate this issue.
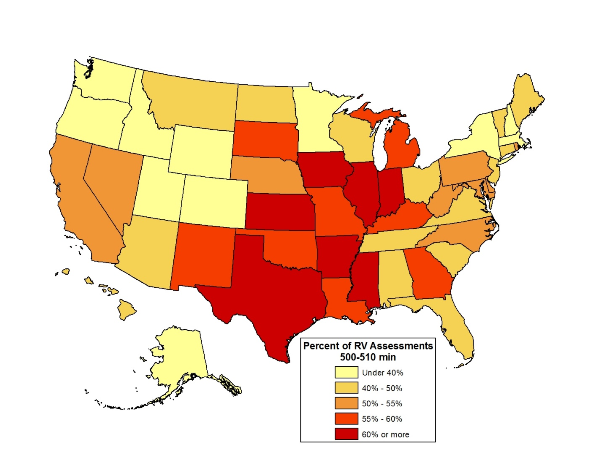
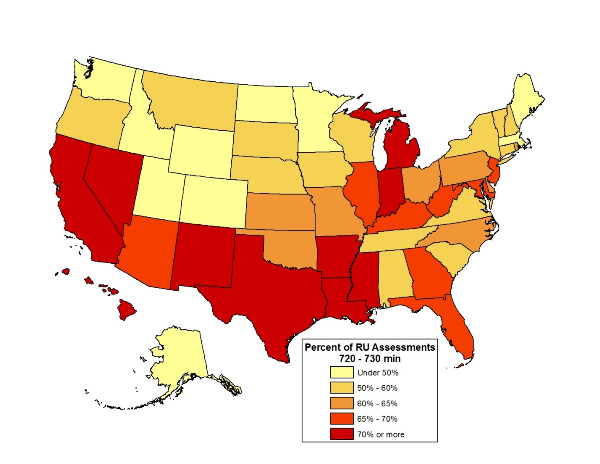
Maps 2 and 3 show the percentage of RV and RU assessments between 500-510 minutes, and 720-730 minutes respectively, by state. States in the Midwest and Texas had particularly high percentages of RV assessments that fell within the ten minute threshold.
The Southwest had notably high percentages of RU assessments that fell within the ten minute threshold, as did California, Nevada and a few Southeastern states. Most of the Mountain states, as well as Alaska, tended to have lower percentages of both RV and RU assessments within the ten minute threshold.
Map 2. Percent of RV Assessments Between 500-510 Minutes, by State, 2013
Map 3. Percent of RU Assessments Between 720-730 Minutes, by State, 2013
*Standardized payment amounts are Medicare payment amounts adjusted for geographic differences in payment rates.
+This category includes beneficiaries who receive 720 minutes or more of physical therapy, occupational therapy, and/or speech language pathology. It also requires that beneficiaries have six to 10 activities of daily living (ADLs). ADLs are used to measure the functional status of an individual to perform routine activities (such as eating, bathing, and dressing) without the need of assistance.


